Saturday, October 27, 2012

Thoughtworks Tech Radar Oct 2012

http://www.thoughtworks.com/articles/technology-radar-october-2012

Techniques

  • micro-services (Dropwizard, declarative provisioning)
  • Edge Side Includes (ESI) for page composition (Varnish)
  • Configuration in DNS 
  • aggregates as documents 
  • automated deployment pipeline (first class in build tool)
  • work-in-progress limits 
  • declarative provisioning. (Pallet)
  • Mobile first 
  • responsive web design 
  • advanced analytics 
  • logs as data 
  • guerrilla user testing, remote usability testing
  • Semantic monitoring (continuously test app in prod through test-execution/real-time monitoring)
  • In-process acceptance testing 
  • Recommend against exhaustive browser based testing.  

Tools

  • Rake for Java and .Net projects.
  • Gradle 
  • GemJars 
  • immutable servers (‘phoenix servers’), Chef/Puppet, software designed to withstand failure
  • Jasmine paired with Node.js
  • Zipkin (monitoring)
  • Zucchini (Cucumber for iOS)
  • JetBrains AppCode IDE (iOS and OS X)
  • Light Table
  • Apache Pig (Hadoop MR pipelines)
  • Crazy Egg (heat maps), Gaze, Silverback
  • Graphite  
  • Riemann (aggregates and relays events in real time)
  • Highcharts
  • D3
  • Dependency Structure Matrices (DSM)
  • embedded servlet containers (SimpleWeb and Webbit)
  • Locust (in-line automated performance testing) Python, better than JMeter or Grinder
  • SaaS performance testing tools (Blitz.io and Tealeaf) 

    Platforms

  • Hybrid clouds
  • open source IaaS (OpenStack or CloudStack)
  • Google BigQuery
  • Microsoft’s Azure 
  • Continuous integration in the cloud (no local software and minimal configuration)
  • mobile payment systems (M-Pesa, Square)
  • MongoDB
  • Neo4j
  • Riak
  • Datomic
  • Couchbase
  • Vert.x 
  • Calatrava (cross-platform mobile application development
  • Meteor.js (client- and server-side JavaScript application framework backed by MongoDB)
  • Demoted: Windows Phone
  • Demoted: Singleton infrastructure  

    Languages & Frameworks

  • JavaScript as a platform
  • Require.js.
  • Twitter Bootstrap
  • Scratch, Alice, and Kodu (programming languages for kids)
  • Lua
  • Sinatra, Flask, Scalatra and Compojure
  • Dropwizard (embedded HTTP server, RESTful endpoints, built-in metrics and health-checks, and straightforward deployments)
  • Gremlin (imperative graph traversal language)
  • Jekyll (“microization” of web publishing framework)
  • RubyMotion (Ruby compiler and toolchain for developing iOS applications)
  • HTML5 for offline application
  • AngularJS and Knockout 
  • Demoted: Backbone.js
  • Demoted: component-based web frameworks (don't attempt to make web development into something that it fundamentally is not

Further Kanban: Classes of Service, Expedited

Classes of service:

Lean Kanban Conference May 2012: http://lkse12.leanssc.org/media.htm


Henrik Kniberg: Kanban vs Scrum

http://www.infoq.com/minibooks/kanban-scrum-minibook

David Anderson intro
  • Visual control mechanism tracks work flow through stages of value stream. 
    • Whiteboard with sticky notes, or electronic card wall system
    • Best practice == do both
    • Generates transparency that contributes to cultural change
  • Exposes bottlenecks/queues/variability/waste – which impact performance of organization in terms of quantity of work delivered and cycle time required
  • Changes behavior and encourages greater collaboration within the workplace
  • Encourages discussion about improvements, and teams quickly start implementing improvements to their process.

Kanban in a nutshell
  1. Visualize the workflow
    • Split the work into pieces, write each item on a card and put on the wall.
    • Use named columns to illustrate where each item is in the workflow.
  2. Limit WIP – assign explicit limits to how many items may be in progress at each workflow state.
  3. Measure lead time & optimize process to make lead time as small and predictable as possible
    • lead time == average time to complete one item (“cycle time”)

On sliding scale from prescriptive to adaptive:
  • Scrum is more prescriptive (iterations, cross-functional teams) than Kanban.  
  • Kanban is more adaptive than Scrum


Roles not prescribed
  • Doesn't mean you shouldn't have them
  • But make sure they add value and don't conflict with other elements of process
  • In a small project, unnecessary roles could lead to waste (or sub-optimisation & micromanagement)
  • Less is more - start with less
  • E.g. "Product Owner" == sets priorites of team
Timeboxes not prescribed - can choose any cadences necessary
  • E.g. Single Cadence (Scrumlike)
    • Plan & Commit every second Monday
    • Demo/release every second Friday
    • Retrospective every second Friday
  • E.g. Three Cadences
    • Every week release whatever is ready for release. 
    • Every second week planning meeting and update our priorities/release plans. 
    • Every fourth week retrospective to tweak and improve our process
  • E.g. Event-driven
    • Trigger planning meeting whenever start running out of stuff to do. 
    • Trigger release whenever set of Minimum Marketable Features (MMFs) ready for release.
    • Trigger spontaneous quality circle whenever bump into same problem second time. 
    • Do in-depth retrospective every fourth week
Kanban limits WIP per workflow state (Scrum limits per iteration)
  • Scrum limits WIP indirectly (theoretical max per column is max of iteration driven by velocity)
  • Kanban limits WIP per column directly
  • Choose what limit to apply to which workflow states
  • Limit WIP of all workflow states
    • Starting as early as possible and ending as late as possible along value stream
    • E.g. consider adding WIP limit to “To do” state as well
  • Once WIP limits in place, can start measuring/predicting lead time
    • Allows to commit to SLAs & make realistic plans
  • If item sizes vary, consider defining WIP limits in terms of story points/whatever unit you use. 
    • Some teams break down items to roughly same size to reduce time spent estimating (estimation can be waste). 
    • Easier to create smooth-flowing system if items are roughly equal-sized
Both are empirical
  • You have to experiment with process and customize it to your environment.
    • Scrum and Kanban just give you basic set of constraints to drive process improvement.
    • Kanban says you should limit WIP. So what should the limit be? Don’t know, experiment
  • Don't have knobs for Capacity/Lead Time/Quality/Predictability
    • Do have indirect controls:
      • Few people <-> Many people
      • Few large teams <-> Many small teams
      • Low WIP limits <-> High WIP limits
      • No iterations <-> Long iterations
      • Little planning <-> Lots of planning
    • E.g. reduce WIP limit
      • Then observe how Capacity/Lead Time/Quality/Predictability change
      • Draw conclusions
      • Change some more things
      • Continuously improve
    • CI = Kaizen, Inspect & Adapt, Empircal Process Control, Scientific Method
    • Feedback loop == most critical element
      • Scrum + XP loops: Sprint, Scrum, CI, UT, Pairing
        • "Are we building the right stuff?" down to "are we building the stuff right?"
      • Kanban: Should use all of the above
      • Kanban adds useful real-time metrics:
        • Average lead-time: Updated when item reaches "Done"
        • Bottlenecks: E.g. Column X crammed with entries, X+1 empty
      • With real-time metrics: Can choose length of feedback loops based on how often you want to analyse and make changes
        • Too long: CI will be slow
        • Too short: process might not have time to stabilise between each change == thrashing
      • Can experiment with feedback loop itself (meta-feedback loop).
  • E.g. Experimenting with WIP
    • E.g. 4 person team, start with WIP of 1
      • E.g. not feasible for all 4 to work on same item ==  people sitting idle (ok occasionally) == avg lead time increases
      • items will get through “Ongoing” really fast once they get in, but they will be stuck in “To Do” longer than necessary, so the total lead time across the whole workflow will be unnecessarily high
    • E.g. increase WIP to 8
      • E.g. problems with integration server prevents cards from being "done"
      • Cards start piling up in "Ongoing" as new work is taken on
      • When WIP 8 is reached, must fix integration server - WIP limit prompted us to react and fix bottleneck instead of piling up unfinished work
      • Good. But if WIP limit was 4 would have reacted earlier, giving better avg lead time. 
      • It’s a balance. Measure avg lead time and keep optimizing WIP limits to optimize lead time
  • Why need a "To-Do" column?
    • Gives team a small buffer to pull work from in absence of customer
    • Not needed if customer always available to tell team what to do
Kanban allows change within iteration
  • Scrum wouldn't allow E to be added to A+B+C+D after committed to sprint.
  • Kanban would allow it but say there's a limit to how many can be added to "To-Do" column so you have to choose to remove one
  • E could be prioritised above other To-Do but work would only start on E once it can be pulled into "Ongoing" column
  • Kanban reponse time (time to respond to a change of priorities) == however long takes for capacity to become available, “one item out = one item in” (driven by WIP limits).
  • Scrum response time == avg half sprint length
Kanban board is persistent - doesn't need to be reset every iteration
Cross-functional teams are optional
  • Board is related to workflow
  • Board not necessarily owned by one team
  • Establish some ground rules as to who uses the board and how then experiment to optimise flow
  • E.g. Whole board served by one cross-functional team - like Scrum
  • E.g. PO sets priorities in column 1
    • Cross-functional dev team does dev (column 2) and test (column 3)
    • Release (column 4) done by specialist team
    • Slight overlap in competencies, so if release team becomes bottleneck one of the devs will help them
Items do not have to fit into a single iteration
  • Kanban teams try to minimize lead time and level flow
    • Indirectly creates incentive to break items into relatively small pieces
  • No explicit rule stating that items must be small enough to fit into a specific time box
  • Same board might have both items that take 1 month and 1 day
 Estimation is not prescribed
  • If you need to make commitments you need to decide how to provide predictability
  • Some teams make estimates and measure velocity just like Scrum
  • Other teams skip estimation, but break each item into roughly same size pieces
    • Can simply measure velocity in terms of how many items completed per unit of time (e.g. features per week)
  • Some teams group items into MMFs (Minimum Marketable Features) and measure avg lead time per MMF, and use that to establish SLAs
    • E.g. “when we commit to an MMF it will always be delivered within 15 days”
  • Lots of interesting techniques for Kanban-style release planning and commitment management
  • Best practices will emerge over time
Both allow working on multiple products simultaneously
  • What if one team maintains multiple products? ("Team Backlog" instead of "Product Backlog")
    • Merge both products into one list. 
    • Forces us to prioritize between products, which is useful in some cases
    • One strategy: focus on one product per sprint
    • Other strategy: work on features from both products each sprint
      • Distinguish with different colours
      • Or separate horizontal swimlanes
Both are lean and agile
  • Pull scheduling systems - JIT inventory management
  • Based on continuous and empirical process improvement *
  • Emphasize responding to change over following a plan (Kanban typically allows faster response than Scrum)
Kanban doesn't prescribe prioritised backlog
  • Can choose any/none prioritisation scheme (don't need to prioritise in advance of timebox)
  • Left-most column typically fills same purpose as backlog
  • Need some kind of decision rule as to which to pull first:
    • Top item
    • Oldest item (each item needs timestamp)
    • Any item
    • 20% maintenance, 80% new features
    • Split between product A and product B
    • Red items first
Daily standups not prescribed
  • Most Kanban teams do it anyway
  • More board-oriented, focusing on bottlenecks/visible problems
  • More scalable - can have 4 teams looking at same board - not everyone needs to speak as long as focus is on bottlenecks
Burndown charts not prescribed
  • No charts prescribed but can use any you want
  • Continuous Flow Diagram (CFD)
    • Every day, total up items in each column and stack on Y axis
    • E.g. day 4, there are 9 items == 1 Production, 1 Test, 2 Dev, and 5 Backlog
    • Plot these points every day and connect the dots
    • Vertical and horizontal arrows illustrate relationship between WIP and lead time. 
    • Horizontal arrow shows that items added to backlog on day 4 took avg 6 days to reach production
    • About half of that time was Test. 
    • Can see that limiting WIP in Test and Backlog would significantly reduce total lead time
    • Slope of dark-blue area shows velocity (i.e. number of items deployed per day). 
    • Over time we can see how higher velocity reduces lead time, while higher WIP increases lead time.
  • Most organizations want to get stuff done faster (= reduce lead time). 
    • Many fall into trap of assuming this means getting more people in or working overtime. 
    • Most effective way to get stuff done faster == smooth out flow and limit work to capacity, not add more people or work harder. 
    • CFD shows why, and increases likelihood team & management will collaborate effectively
  • Even more clear if distinguish between queuing states (such as “waiting for test”) and working states (such as “testing”). 
    • Want to absolutely minimize number of items sitting around in queues, CFD helps provide right incentives for this
Scrum vs Kanban Example
  • Sprint backlog == just one part of picture
  • Why split “Dev” column into “Ongoing” and “Done”? 
    • Gives production team chance to know which items they can pull into production.
  • Why share "Dev" limit of 3 among the two sub-columns?
    • Creates excess capacity
    • Developers who could start a new item, but aren’t allowed to because of the Kanban limit.
    • Gives strong incentive to focus efforts and help get stuff into production, to clear the “Done” column and maximize flow. 
    • Nice and gradual effect – the more stuff in “Done”, the less stuff is allowed in “Ongoing” – helps the team focus on right things.
  • One piece flow
    • “perfect flow” scenario, where an item flows across the board without ever getting stuck in a queue. 
    • At every moment there is somebody working on that item
    • Can get rid of backlog and selected columns for a really short lead time
    • Cory Ladas: “Ideal work planning process should always provide dev team with best thing to work on next, no more and no less”
    • WIP limits are there to stop problems from getting out of hand - if things are flowing smoothly WIP limits aren’t really used
Questions
  • Only thing that Kanban prescribes is that work flow is visual, and WIP is limited
  • Purpose == create smooth flow through system and minimize lead time. 
  • Need to regularly bring up questions such as:
    • Which columns should we have?
      • Each column represents:
        • one workflow state
        • a queue (buffer) between two workflow states
      • Start simple and add columns as necessary
    • What should the Kanban limits be?
      • When the Kanban limit for “your” column has been reached and you don’t have anything to do, start looking for a bottleneck downstream (i.e. items piling up to the right on the board) and help fix the bottleneck. 
      • No bottleneck == Kanban limit might be too low - reason for having limit was to reduce risk of feeding bottlenecks downstream. 
      • Many items sit still for a long time without being worked on == Kanban limit might be too high
      • Too low kanban limit => idle people => bad productivity 
      • Too high kanban limit => idle tasks => bad lead time

* empirical process improvement 
  • http://barryhawkins.com/blog/2012/04/13/empirical-process-control-why-scrum-works/
  • Empirical process control provides and exercises control through frequent inspection and adaptation for processes that are imperfectly defined and generate unpredictable and unrepeatable outputs
  • Requires three basic elements: 
    • Transparency: ensures all elements in a process are openly observable
    • Inspection: taking observation enabled by transparency and critically evaluating how work flows through the process (cross-functional team)
    • Adaptation: takes insights gleaned from that inspection as basis for making incremental ongoing improvements to process

Kanban Resources

http://limitedwipsociety.ning.com/

http://kanbanresources.com

4 easy steps: http://kanbantool.com/kanban-library/introduction
  1. Visualise your work
  2. Limit WIP
    1. 100% capacity = minimal throughput
    2. maintain flow, eliminate waste
  3. Don't push too hard (pull instead)
  4. Use it (then monitor, adapt, improve)
    1. CFD
    2. kanbantool.com
    3. Mix kanban with something you like (scrumban, pomodoroban
Kick-Start Example: http://www.crisp.se/file-uploads/kanban-example.pdf

Agile Academy Kanban

http://www.agileacademy.com.au/agile/sites/default/files/Kanban.pdf


  • Not timeboxed
  • Focussed on the flow of work, removing sources of variability  
  • Work is pulled from the back of the flow (rather than pushed from the front)
  • WIP == limits how much work can be in any one flow state at a point in time.
    • Encourages"swarming‟ around roadblocks to ensure removed ASAP
  • "Lead time‟ == Measurement of flow (instead of Velocity )
    • Cumulative Flow Diagrams and Variability Diagrams track progress (rather than Burn Up or Down charts)  
  • Work broken down to roughly similar size.  
  • Tracks flow of stories and associated "epic" ("minimum marketable feature") 
  • Embedded process for handling:
    • expedited items 
    • fixed delivery dates
    • work type splitting (e.g. enhancements, production defects, and text changes) 
  • Slack deliberately encouraged to allow for CI to process to be identified/actioned 
  • Prioritisation of backlog performed just in time


Thursday, October 25, 2012

Henry Kniberg: Cause and Effect & A3 Problem Solving

Cause & Effect Diagrams: www.crisp.se/henrik.kniberg/cause-effect-diagrams.pdf

  • Also Ishikawa Fishbone Diagram
  • Benefits:
    • Creates a common understanding - practical collaboration
    • Focuses on most important problems first
    • Helps turn vicious cycles into positive reinforcing loops (good stuff leading to more good stuff, instead of bad stuff leading to more bad stuff)
  • All problems are systemic - don't point fingers - the systems broken to allow this to happen
  • Until you find the source of the glitch, most attempts to fix the problem will be
    futile or even counterproductive.
  • Used as the root cause analysis of A3 problem solving (more below)
  • Basic process: 
  1. Select a problem – anything that’s bothering you - and write it down.
  2. Trace “upwards” to figure out the business consequences, the “visible damage” that your problem is causing. 
  3. Trace “downwards” to find the root cause (or causes).  
  4. Identify and highlight vicious cycles (circular paths) 
  5. Iterate the above steps a few times to refine and clarify your diagram 
  6. Decide which root causes to address and how (i.e. which countermeasures to implement)
  • Countermeasures are just experiments - prod the system to see how it will work
    • If they don't work, analyse, update diagram, try other countermeasures
    • Follow-up is important
  • Failure == system trying to tell you something, better listen
  • "Only real failure is failure to learn from failure"
  • Ask "so what" until get to problem(s) that conflicts with goal
    • Analyse consequences of problem:
      • Quantify: How much revenue/customers lost?
      • How do you know when you've solved problem?
  • Ask "why" until dig down towards the root
  • Vicious cycles: recurring problems usually involve re-inforcing loops
  • Spotting them increases likelihood of solving
  • Easy to miss important causes on first pass - go back and ask more "why"s
  • Label root causes, propose countermeasures
  • Root causes:
    • only have arrows going out
    • further whys don't feel meaningful
    • issues is something we can address with significant positive effect
  • It typically takes about 5 whys to get to the root
  • In between problems and root causes are symptoms
  • Without analysis, jump to conclusions & execute ineffective/counterproductive changes. 
    • E.g. adding more people, though head count had nothing to do with the problem. 
    • E.g. changing the incentive model (reward people for releasing on time or punish people for releasing late)
  • How to create
    • Alone: powerpoint/Visio
    • Small group: whiteboard with post-its, everybody helps
    • Large group (>8): split into groups, same problem, compare at end
  • Maintaining: Worth keeping in Visio/Powerpoint, replicating on whiteboard for updates, synchronising with soft copy
  • Pitfalls:
    • Too complex
      • Remove redundant boxes
      • Focus depth first, write one or two most important problems, dig deeper
      • Problem too broad? Limit to narrowly defined problem
      • Split diagram into pieces (point to stack of "etc" boxes)
    • Too simple
  • Never perfect: "all models are wrong but some are useful"
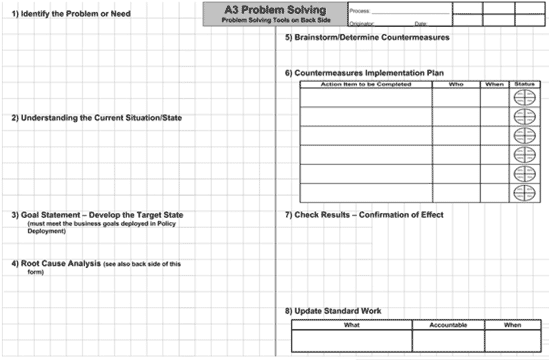

A3 Template: http://www.crisp.se/gratis-material-och-guider/a3-template  PDF, Word
  1. Identify the problem or need
  2. Understand the current situation/state
  3. Develop the goal statement – develop the target state
  4. Perform root cause analysis
  5. Brainstorm/determine countermeasures
  6. Create a countermeasures implementation plan
  7. Check results – confirm the effect
  8. Update standard work
These steps follow the Deming Plant-Do-Check-Act (PDCA) cycle, with steps 1 through 5 being the ”Plan”, Step 6 being the “Do”, Step 7 being the “Check” and Step 8 being the “Act”.
 On the A3 template, the steps are typically laid out like this:

Wednesday, October 24, 2012

Henri Kniberg Kanban Links & Comic


  • Know your goal
    • Hint: Agile/Lean/Kanban/Scrum isn’t it.
  • Never blame the tool
    • Tools don’t fail or succeed. People do.
    • There is no such thing as a good or bad tool. Only good or bad decisions about when, where, how, and why to use which tool.
  • Don’t limit yourself to one tool
    • Learn as many as possible.
    • Compare for understanding, not judgement.
  • Experiment & enjoy the ride
    • Don’t worry about getting it right from start; you won’t.
    • The only real failure is the failure to learn from failure.

Comic Strip: http://blog.crisp.se/2009/06/26/henrikkniberg/1246053060000


"The change from 2 to 3 developer limit was mostly to show that it can change. In this case to accommodate a higher variability"

"To be for or against Kanban would be as silly as being for or against staplers. It’s all about context"


Sunday, October 21, 2012

HTTP Draft


HTTP/1.1: Semantics and Content
Application-level protocol for distributed, collaborative, hypertext information systems. 

Table of Contents
   5.  Request Methods . . . . . . . . . . . . . . . . . . . . . . .  22
       5.2.1.  Safe Methods  . . . . . . . . . . . . . . . . . . . .  24
       5.2.2.  Idempotent Methods  . . . . . . . . . . . . . . . . .  25
       5.2.3.  Cacheable Methods . . . . . . . . . . . . . . . . . .  25
     5.3.  Method Definitions  . . . . . . . . . . . . . . . . . . .  25
       5.3.1.  GET . . . . . . . . . . . . . . . . . . . . . . . . .  25
       5.3.2.  HEAD  . . . . . . . . . . . . . . . . . . . . . . . .  26
       5.3.3.  POST  . . . . . . . . . . . . . . . . . . . . . . . .  27
       5.3.4.  PUT . . . . . . . . . . . . . . . . . . . . . . . . .  28
       5.3.5.  DELETE  . . . . . . . . . . . . . . . . . . . . . . .  30
       5.3.6.  CONNECT . . . . . . . . . . . . . . . . . . . . . . .  30
       5.3.7.  OPTIONS . . . . . . . . . . . . . . . . . . . . . . .  32
       5.3.8.  TRACE . . . . . . . . . . . . . . . . . . . . . . . .  33
   7.  Response Status Codes . . . . . . . . . . . . . . . . . . . .  46
     7.2.  Informational 1xx . . . . . . . . . . . . . . . . . . . .  49
       7.2.1.  100 Continue  . . . . . . . . . . . . . . . . . . . .  49
       7.2.2.  101 Switching Protocols . . . . . . . . . . . . . . .  49
     7.3.  Successful 2xx  . . . . . . . . . . . . . . . . . . . . .  50
       7.3.1.  200 OK  . . . . . . . . . . . . . . . . . . . . . . .  50
       7.3.2.  201 Created . . . . . . . . . . . . . . . . . . . . .  50
       7.3.3.  202 Accepted  . . . . . . . . . . . . . . . . . . . .  51
       7.3.4.  203 Non-Authoritative Information . . . . . . . . . .  51
       7.3.5.  204 No Content  . . . . . . . . . . . . . . . . . . .  51
       7.3.6.  205 Reset Content . . . . . . . . . . . . . . . . . .  52
     7.4.  Redirection 3xx . . . . . . . . . . . . . . . . . . . . .  52
       7.4.1.  300 Multiple Choices  . . . . . . . . . . . . . . . .  54
       7.4.2.  301 Moved Permanently . . . . . . . . . . . . . . . .  54
       7.4.3.  302 Found . . . . . . . . . . . . . . . . . . . . . .  55
       7.4.4.  303 See Other . . . . . . . . . . . . . . . . . . . .  55
       7.4.5.  305 Use Proxy . . . . . . . . . . . . . . . . . . . .  56
       7.4.6.  306 (Unused)  . . . . . . . . . . . . . . . . . . . .  56
       7.4.7.  307 Temporary Redirect  . . . . . . . . . . . . . . .  56
     7.5.  Client Error 4xx  . . . . . . . . . . . . . . . . . . . .  56
       7.5.1.  400 Bad Request . . . . . . . . . . . . . . . . . . .  56
       7.5.2.  402 Payment Required  . . . . . . . . . . . . . . . .  56
       7.5.3.  403 Forbidden . . . . . . . . . . . . . . . . . . . .  57
       7.5.4.  404 Not Found . . . . . . . . . . . . . . . . . . . .  57
       7.5.5.  405 Method Not Allowed  . . . . . . . . . . . . . . .  57
       7.5.6.  406 Not Acceptable  . . . . . . . . . . . . . . . . .  57
       7.5.7.  408 Request Timeout . . . . . . . . . . . . . . . . .  58
       7.5.8.  409 Conflict  . . . . . . . . . . . . . . . . . . . .  58
       7.5.9.  410 Gone  . . . . . . . . . . . . . . . . . . . . . .  58
       7.5.10. 411 Length Required . . . . . . . . . . . . . . . . .  59
       7.5.11. 413 Request Representation Too Large  . . . . . . . .  59
       7.5.12. 414 URI Too Long  . . . . . . . . . . . . . . . . . .  59
       7.5.13. 415 Unsupported Media Type  . . . . . . . . . . . . .  59
       7.5.14. 417 Expectation Failed  . . . . . . . . . . . . . . .  60
       7.5.15. 426 Upgrade Required  . . . . . . . . . . . . . . . .  60
     7.6.  Server Error 5xx  . . . . . . . . . . . . . . . . . . . .  60
       7.6.1.  500 Internal Server Error . . . . . . . . . . . . . .  60
       7.6.2.  501 Not Implemented . . . . . . . . . . . . . . . . .  60
       7.6.3.  502 Bad Gateway . . . . . . . . . . . . . . . . . . .  61
       7.6.4.  503 Service Unavailable . . . . . . . . . . . . . . .  61
       7.6.5.  504 Gateway Timeout . . . . . . . . . . . . . . . . .  61
       7.6.6.  505 HTTP Version Not Supported  . . . . . . . . . . .  61