The Problem
Deploying software as containers promises to solve many problems with regards to interoperability of environments, speed to deploy, and cost reduction. But understanding where our software lives now becomes more difficult both for development and operations teams. This is due to the fact that it is quite laborious to find the information indicating where the software is now located and the quantity of resources still available for more software. Several ECS console screens must be viewed, and the amount of time required to process this information grows with the amount of software deployed.
c3vis
c3vis aims to give administrators and teams one place to gain rapid insight into the state of where the containers are running and the capacity available for more containers.
How it Works
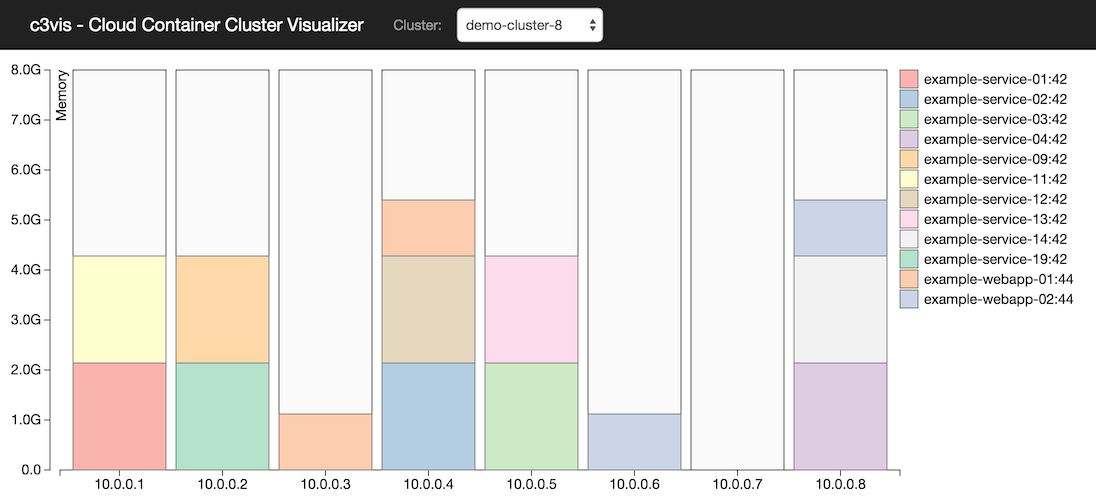
c3vis is a NodeJS server that retrieves information about the Instances and Tasks for the selected cluster from the ECS API (using the AWS JavaScript SDK). The client processes this information using D3.js to display the EC2 instances in the selected cluster as vertical bars. The Tasks allocated to the instances are represented as stacked boxes indicating their reserved memory. Each unique Task Definition is represented as a different colour, with the legend showing the Task Family name and revision number. Each Task will contain one or more containers, the size of the Task box represents accumulated reserved memory for all containers in the Task.
Why I Created it
At Expedia we're using Amazon ECS to serve highly available clusters of applications. ECS helps to save costs and speed up deploys (traditionally done with blue-green deploys to clusters of dedicated immutable instances, requiring over-allocation of resources and time-consuming AMI creation). My colleague and I have been automating deploys of microservices to ECS. Diagnosing problems post-deploy is time-consuming: where was the container installed? why don't I have enough resources?
Having a single console that summarises ECS clusters visually has been helpful for 1) quickly identifying where to perform further diagnosis, 2) quickly estimating whether the current instance types will suffice as the cluster grows, and 2) explaining concepts to development teams that are on-boarding to ECS.
Future Directions
Here are some enhancement ideas for c3vis:
- Multi-region, multi-account support
- Represent reserved CPU in addition to memory
- Show an exploded view of task with more details:
- Show containers within tasks
- Show memory breakdown across containers
- Sliding time-bar to see historical data for comparison of cluster state
- Show container actual memory utilisation vs reserved memory utilisation
- Show Service names (toggle-able with Task names)
- Support more than 100 instances
- Write a plugin system that lets adopters plugin visualisations of their own statistics from favourite monitoring tool
- Cache responses server-side to reduce AWS API calls
- Make the data transfer between client and server more efficient - Separate requests for task and instance data and populate graph asynchronously
- Pluggable backend system that could support other public or private cloud providers
- Provide access to more troubleshooting information (such as docker logs, ECS logs)
Amazon ECS Data Model Limitations
The ECS data model has made getting the information needed for c3vis difficult. Looking forward to hopefully seeing more two-way relationships between ECS data types:
- Mapping from ContainerInstance to Tasks - currently have to traverse all Tasks and group by InstanceId.
- Mapping from Task to Service - currently have to traverse all Services and group by Task ARN.
Helping Out
Feedback and pull requests are welcome, c3vis is licensed under Apache 2.0.